How to Build a Solo GDPR Admin Dashboard
A solo developer needs metrics as much as a 50-person team. Maybe even more. When you're alone managing the backend, frontend, marketing, and support, you can't afford to guess what's happening. You need to see: how many users are active, which features are being used, if the backend is handling the load, if the voice pipeline is crashing.
I built a complete admin dashboard for TAMSIV, an email alert system for critical incidents, and GDPR-compliant analytics tracking. Here's how it all fits together, and why each piece is essential when you're operating solo.
Key takeaways:
- An admin dashboard isn't a luxury — it's vital for a solo dev in production
- GA4 with Consent Mode allows for GDPR compliance without sacrificing metrics
- Email alerts (AlertService) detect problems before users do
- A 3-toggle cookie consent with versioning is the minimum for GDPR in Europe
- Dual tracking (GA4 + Supabase) covers web metrics AND business metrics
Why does a solo developer need an admin dashboard?
The short answer: because you don't have an SRE team, no product manager, no analyst. You are all of that at once. And without visibility into what's happening in your app, you're making decisions blindly.
Before the dashboard, I discovered problems through user feedback (when they bothered to write). A crash of the voice pipeline could remain invisible for hours. A spike in registrations went unnoticed. A feature nobody used continued to cost me maintenance time.
The admin dashboard changed that. Accessible at /admin/dashboard on tamsiv.com, it gives me a real-time view of everything that matters:
- Users: Daily registrations, active users (DAU/WAU/MAU), retention
- Features: Use of the voice recorder, task/memo/event creation, gamification
- Infrastructure: WebSocket latency, STT error rate, LLM fallbacks triggered
- Business: Free → Pro conversions, RevenueCat revenue, churn rate

How to build an admin dashboard with Recharts and Supabase?
The dashboard is built with Recharts, a React charting library based on D3.js. Why Recharts? Because it integrates natively with React, supports SSR (important for Next.js), and rendering is clean without complex configuration.
The architecture is simple:
- Data: Everything comes from Supabase via RPC functions. Each graph has its own RPC that aggregates data server-side.
- Stats cards: At the top of the dashboard, cards show real-time KPIs (total users, active today, tasks created, etc.).
- Time-series graphs: Daily registration curves, feature usage, retention histograms.
- Tables: List of recent events (registrations, errors, alerts).
An important point: Supabase RPCs use parameters with the p_ prefix (project convention). For example, p_start_date, p_end_date, p_metric_type. These RPCs perform aggregation calculations directly in PostgreSQL — much more performant than fetching thousands of rows client-side.
The dashboard is protected by an admin role check at the Next.js middleware level. Only users with the admin role in Supabase Auth can access it.
What is AlertService and why is it critical in production?
The dashboard is for when you're in front of your screen. But incidents don't wait for you to open the dashboard. The AlertService is my automatic monitoring system that sends me an email when something abnormal happens.
Here are the configured alerts:
- LLM fallback triggered: When the main model (via OpenRouter) fails and the fallback takes over. This indicates a provider issue or a load spike.
- Repeated voice pipeline errors: If the STT or TTS fail more than X times in Y minutes, I receive an email. This could indicate a Deepgram outage or an OpenAI quota issue.
- Excessive rate limiting: If a user or IP triggers the rate limiter repeatedly, it could be abuse or a bot.
- Registration failure: If the registration flow (email or QR code) fails for multiple users, there's likely a bug.
Emails are sent via Resend, a simple and reliable transactional email service. Each alert is also logged in a Supabase table for history — I can find the incident history in the admin dashboard.
How to implement GA4 with GDPR Consent Mode?
GDPR (General Data Protection Regulation) is non-negotiable for a European website. This means: no tracking without explicit consent. Google Analytics 4 natively supports Consent Mode, a mechanism that adjusts its behavior according to user consent.
Here's how it works in tamsiv.com:
- Initialization in "denied" mode: GA4 is loaded at site startup, but with
analytics_storage: 'denied'andad_storage: 'denied'. No data is collected. - Explicit consent: When the user accepts analytics cookies in the banner, consent is updated via
gtag('consent', 'update', { analytics_storage: 'granted' }). - Modeling: With Consent Mode, Google uses modeling to estimate data from users who have not consented. You get reliable trends even if 50% of visitors refuse tracking.
The GA4 tag (G-VVLHW673V3) is initialized only once, on the first page load. Consent is persisted in a first-party cookie and restored on each visit. If the user changes their mind, they can modify their preferences in the cookie banner accessible from the footer.
How to design a GDPR-compliant cookie consent?
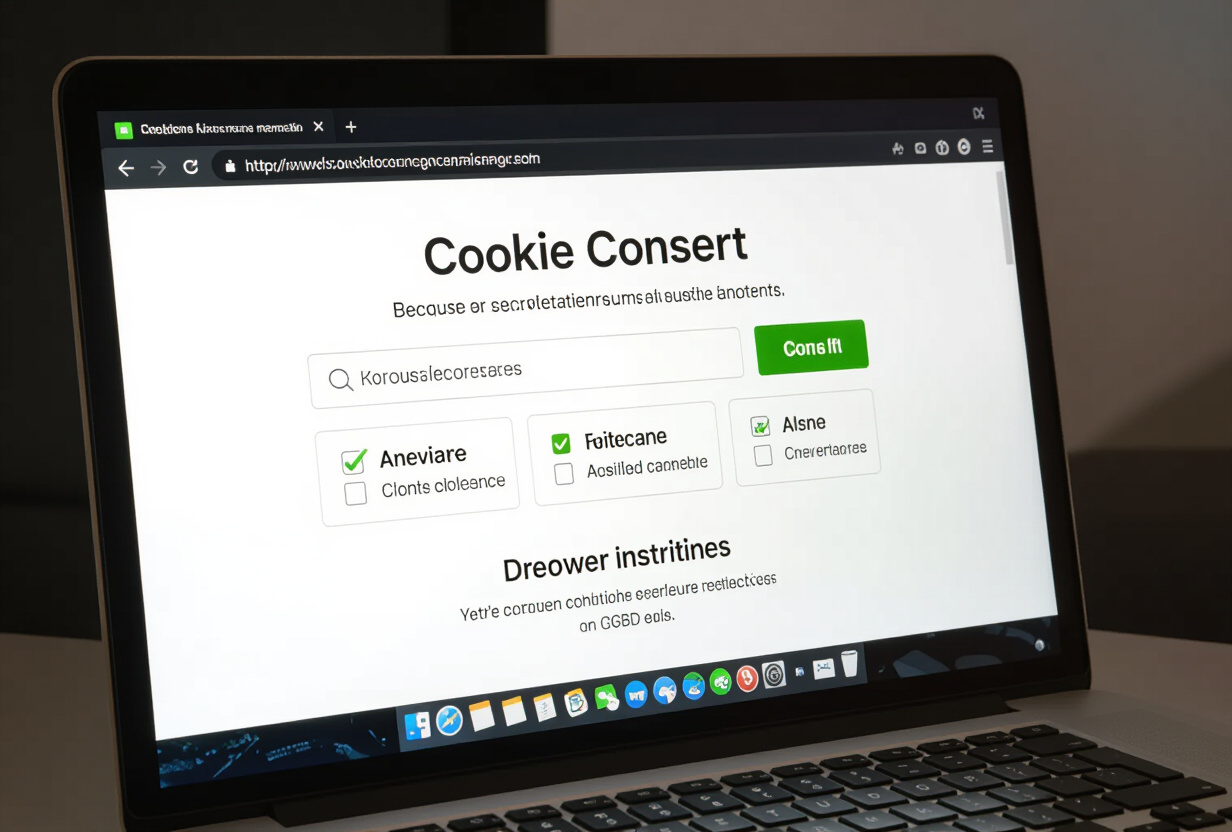
TAMSIV's cookie banner has 3 toggles, each with a specific role:
- Necessary (always active, non-deactivatable): Auth session, language preferences, cookie consent itself. Without these cookies, the site does not function.
- Analytics (disabled by default): GA4, Supabase navigation metrics. Active only after consent.
- Marketing (disabled by default): Planned for the future (retargeting, advertising pixels). Disabled for now as not used.
An often overlooked point: consent versioning. If the cookie policy changes (addition of a new tracker, modification of purposes), the banner must reappear for all users, even those who have already consented. I implemented this with a version number stored in the consent cookie. When the version changes, the banner reappears.

Why use dual tracking with GA4 + Supabase?
GA4 is excellent for standard web metrics: page views, bounce rate, traffic sources, conversions. But there are metrics that GA4 cannot capture, or not finely enough:
- Detailed conversion path: The exact path of a visitor from the landing page to registration, with intermediate interactions (CTA click, FAQ opening, language change).
- Business metrics: Number of tasks created via web vs. mobile app, task completion rate, gamification activity.
- Multi-device attribution: A user who discovers the site on desktop and downloads the app on mobile. GA4 doesn't make this link. Supabase, with the auth UUID, does.
Supabase tracking works with an anonymous UUID per visitor (generated on first load, stored in localStorage). Each significant interaction is logged in a Supabase table. When the visitor registers, the anonymous UUID is linked to their auth account — which allows reconstructing the complete journey, from the first click to registration.
This dual tracking gives me two complementary readings: GA4 for macro trends (where visitors come from, which pages perform) and Supabase for micro insights (what is the typical path that leads to a conversion).
Which metrics to prioritize for a mobile app?
When you start, you're tempted to measure everything. Bad idea — you'll drown in data without taking any action. Here are the metrics I prioritize in the TAMSIV dashboard:
- DAU (Daily Active Users): The app's pulse. If it drops, something is wrong.
- D1/D7/D30 Retention Rate: How many users return. This is the most important metric for a productivity product.
- First task completion rate: Do new users succeed in creating their first task? If not, the onboarding has a problem.
- Free → Pro Conversion: The core of the business. How many free users become paying, and after how many days of use.
- Voice pipeline error rate: The percentage of voice conversations that fail. Must remain below 2%.
Each of these metrics has its graph in the dashboard, with a 7-day and 30-day trend. A colored threshold system (green/orange/red) allows me to see at a glance if everything is going well.
How have email alerts saved my production?
Concrete example: one Saturday evening, I received an email "LLM Fallback triggered — 12 times in 15 minutes". The main model on OpenRouter was overloaded. Without an alert, I would have discovered it on Monday by looking at the metrics. Thanks to the alert, I checked that the fallback was working correctly (it was) and I could communicate proactively if necessary.
Another example: a spike in rate limiting on a specific IP. Investigating, I discovered an automated script attempting to create accounts en masse. The rate limiter had done its job, but the alert allowed me to block the IP and strengthen protection.
The AlertService is my safety net. It doesn't replace monitoring (I also use Railway logs for the backend), but it warns me of the most critical incidents without me needing to actively monitor.
FAQ
Do you need an admin dashboard from launch?
Not necessarily on day 1, but as soon as you have users in production, yes. I built it a few weeks before launch and it saved me several times. At a minimum, configure email alerts — that's more urgent than the visual dashboard.
Is GA4 compatible with GDPR without consent?
No. Even with Consent Mode in "denied" mode, GA4 sends anonymous pings to Google. To be 100% compliant, you must display a cookie banner and only load GA4 after consent, or use Consent Mode which adjusts behavior. Consent Mode is the solution recommended by Google and accepted by most European DPAs.
Why Recharts instead of Chart.js or D3 directly?
Recharts is a React wrapper around D3. The advantage: charts are declarative React components, not imperative code. It's more natural in a Next.js project. Chart.js also works, but requires more integration code with React.
How much does the email alert system with Resend cost?
Resend's free plan includes 3000 emails per month. For alerts (a few dozen per month in normal operation), this is largely sufficient. The cost is therefore zero for a small project in production.
Doesn't Supabase tracking duplicate GA4?
No, they measure different things. GA4 excels at web traffic (sources, behavior, conversions). Supabase measures in-app behavior (tasks created, features used, multi-device journeys). The two are complementary, not redundant.